Modern healthcare is all about prevention. Yearly checkups, regular blood tests, tracking fitness goals is all the rage right now, and for the better — preventative healthcare is proving to provide the best outcomes for health-conscious people and patients everywhere.
Users at home are always looking for new ways to automate daily tasks and delegate a portion of their daily tasks to a digital assistant of some kind.
Look at how popular smartwatches are — people want to have easy access to their health data and track their health indicators at home, without the need to visit a healthcare facility.
Pulse trackers, blood oxygen trackers, step and calorie counters are just a few examples of how software has automated healthcare for people everywhere.
AI Revolution In Healthcare
With the rise of AI and machine learning, the field of personal wellness has experienced a new round of development: now, machines can perform complex analysis of visual and text data to provide even deeper insights into a person's health.
One of the key aspects of making preventative healthcare accessible to everyone is making diagnostics easy.
Typically, medical testing happens in a healthcare facility, and waiting time can be anywhere from 24 hours to multiple days. Tracking certain health markers can prove to be difficult with how the current system is set up.
AI For Urine Strip Detection
A powerful computer vision neural network integrated into a user-friendly mobile app can become a reliable assistant helping to monitor main heath markers at home. AI for personal wellness can help quickly and reliably interpret results of at-home tests, from testing strips to medical gadgets like glucometers.
Read also:
Testing strips, like urinalysis strips, are a quick and convenient way of tracking certain health markers at home. Medical testing strips, like urine testing strips, are one of the fastest ways to track health markers quickly and with reasonable accuracy.
Testing strips have chemical pads on them, which change color depending on the presence of certain chemicals it has come in contact with.
A healthcare provider, or a patient themselves then refers to a color chart to interpret the results. This is where computer vision comes into the picture (no pun intended): color analysis done by a person can be inaccurate, while an automated system will provide highly accurate test results in a matter of seconds.
Image Quality And Detection Results
When it comes to computer vision, the results of recognition are highly dependent on the image. In theory, taking a photo of a testing strip and sending it to a neural network for recognition is fairly straightforward and easy. In practice, there a number of obstacles:
- different lighting conditions
- different backgrounds
- different smartphone camera settings
All of these cause color variability, which is detrimental to the final result. The slightest difference in colors of the chemical pads can affect the test results significantly. Calibrating the photo to achieve accurate color rendering is a non-obvious, but a very important step
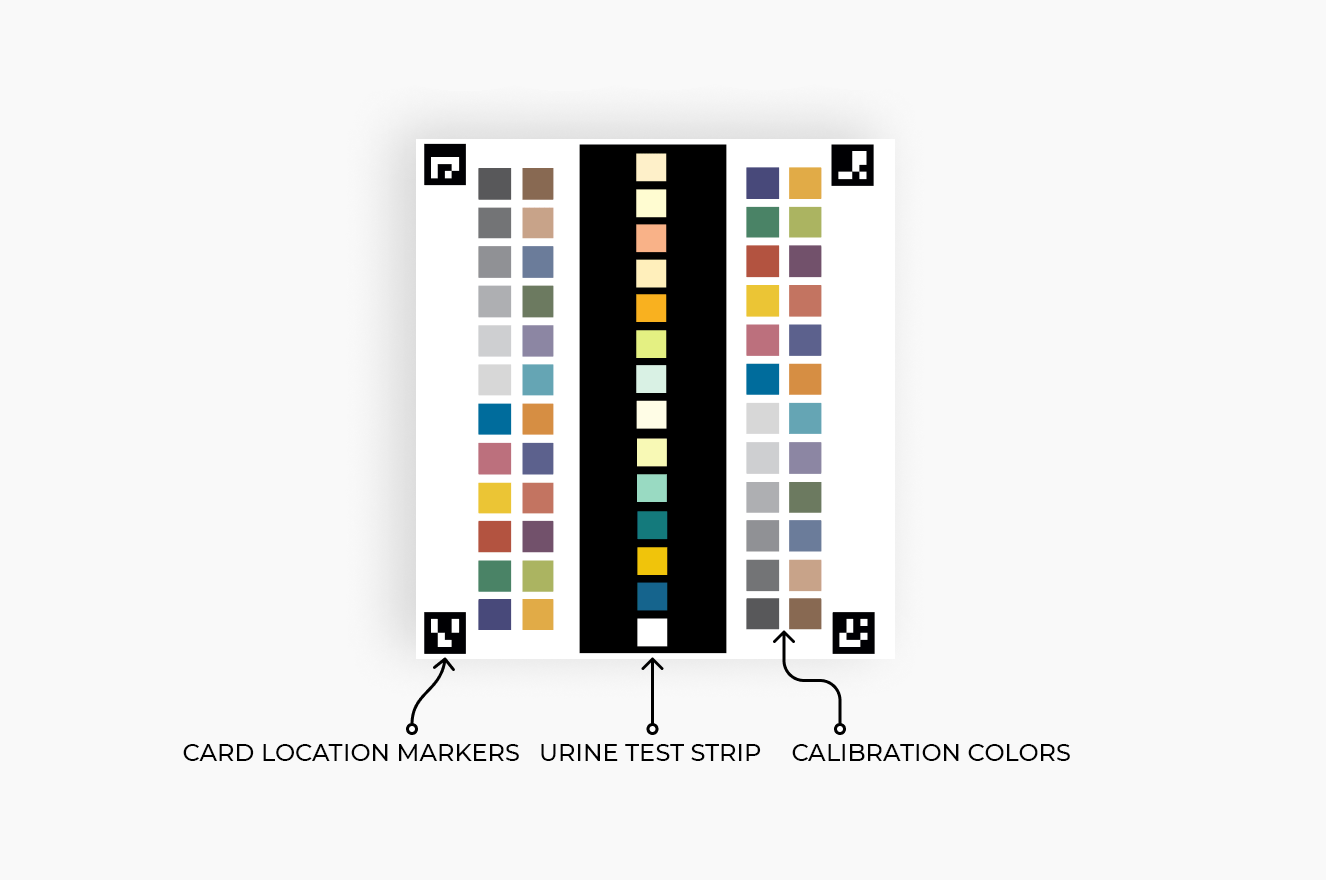
Detecting Colors Of Chemical Pads
The core task of automating test strip analysis is detection of colors of chemical pads and their comparison to the color chart. Correct comparison is only possible after color calibration. As we've already noted, the tones in a photo can change due to various factors, including lighting, objects nearby in the frame, and camera settings.
This is where a color calibrating background comes into play: by placing the strip next to a calibration background, the system can adjust for the difference in lighting and other factors to provide the most accurate result.
Color Calibration
Comparison of chemical pads colors to the colors on the calibrating background is a complex step on the way to the final product. We have selected several color calibration methods and created typical synthetic tests for this. Knowing the real reagent values from the test images, we can compare them with the values produced by the algorithm and calculate the accuracy.
The are 2 color comparison methods that could be used in this setting:
- Histogram matching calibration is the process of fitting the image histogram to the histogram of the reference image. In our case, the reference is the calibration background
- Calibration using regression
The histogram represents the distribution of pixels with different brightness for each of the RGB channels. Thus, by adjusting the histogram to the reference one, we make the colors more similar to the reference ones.
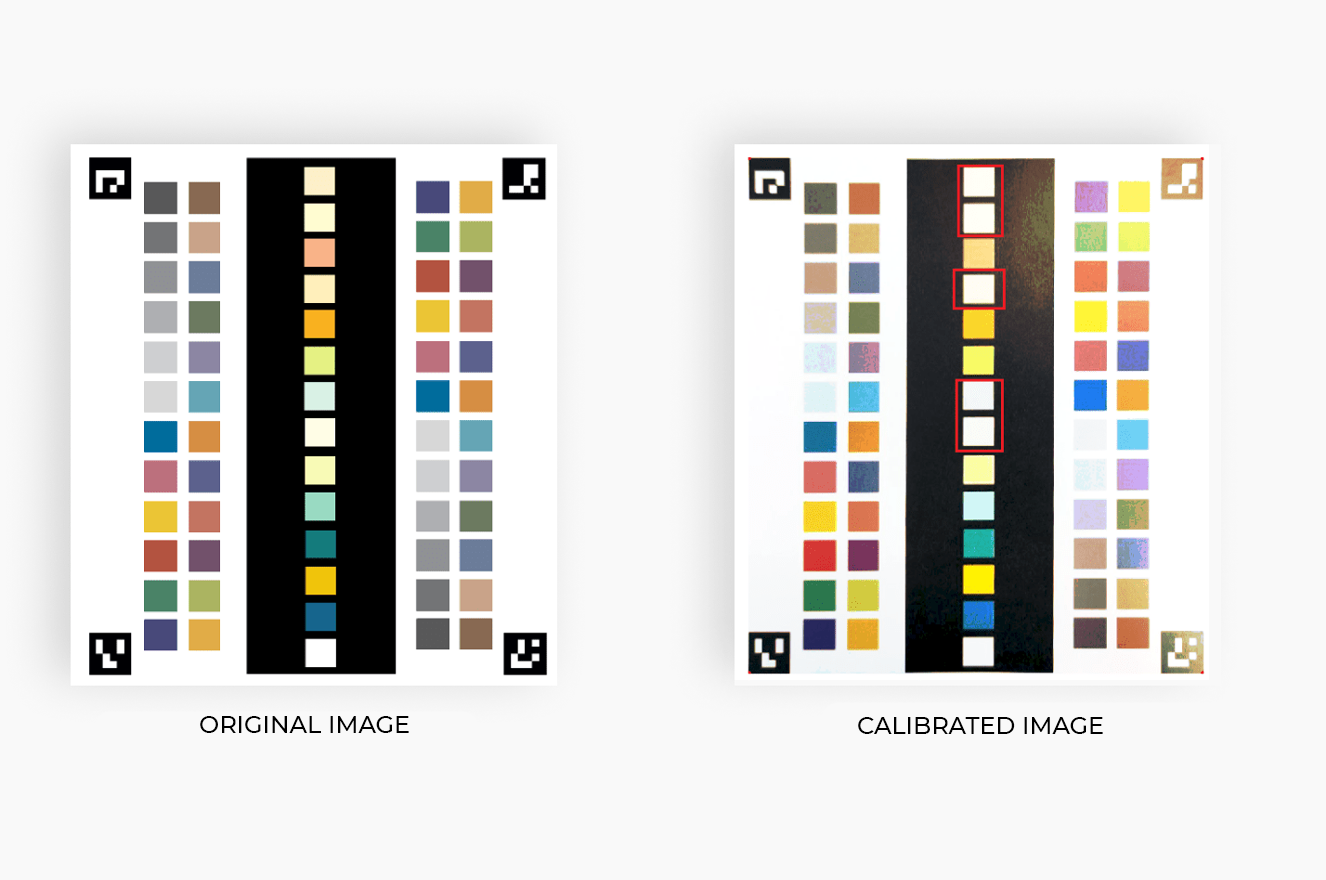
The histogram matching calibration method gives low quality results. The picture below shows the original image on the left and the same image after calibration on the right. You can see that the light shades (colors highlighted in red) are overexposed, making it impossible to correctly determine the corresponding reagent values.
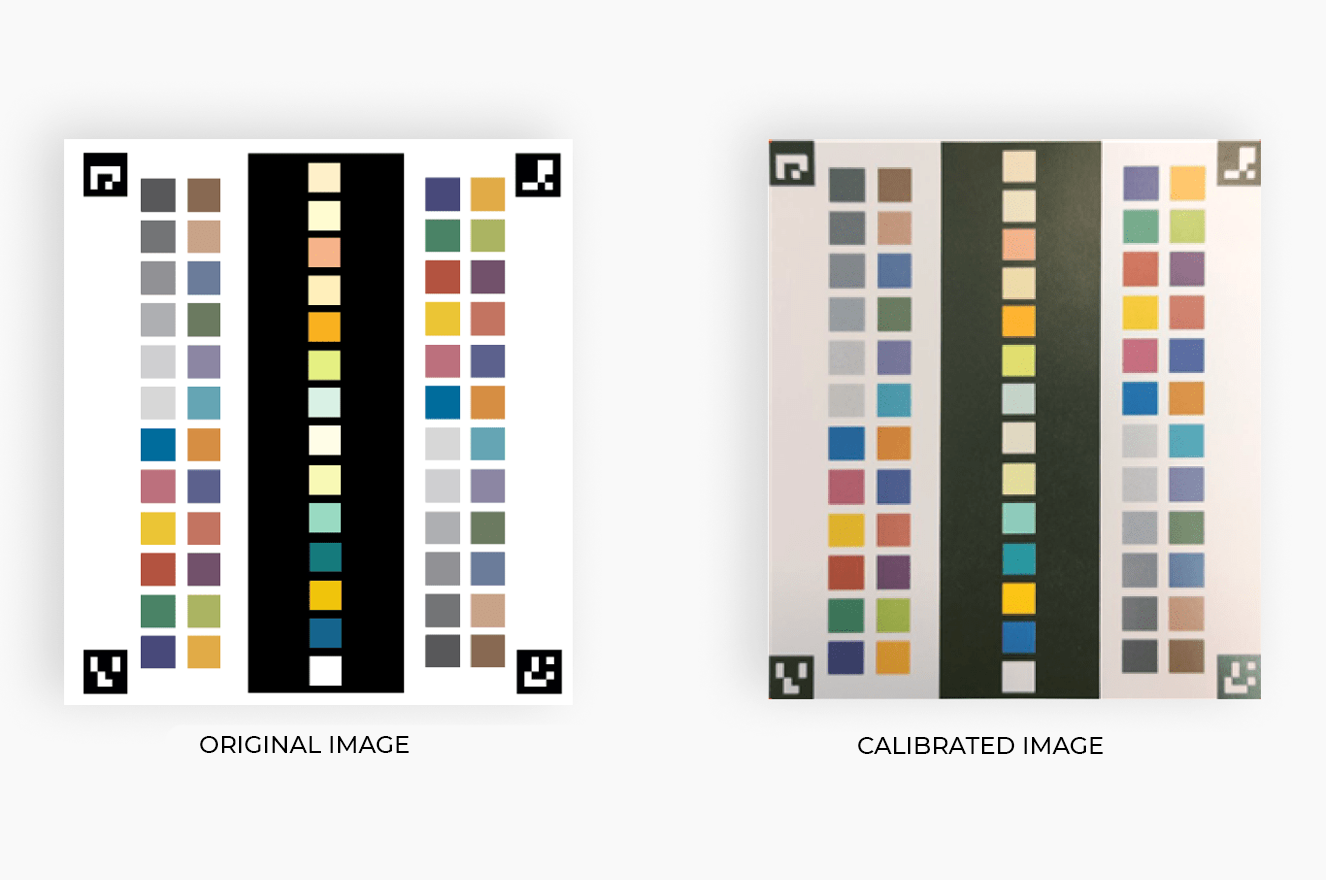
Partial least squares regression, or PLS regression, is a method which consists of adjusting the RGB values of calibration colors from a photo to the specified RGB values of these colors.
In other words, this method finds how to transform the image so that the RGB values of the calibration colors match the given values.
The result of calibration by this method gave satisfactory results: all reagent values are determined correctly, the determination accuracy was 90%.
Neon And Pastel Reagent Colors
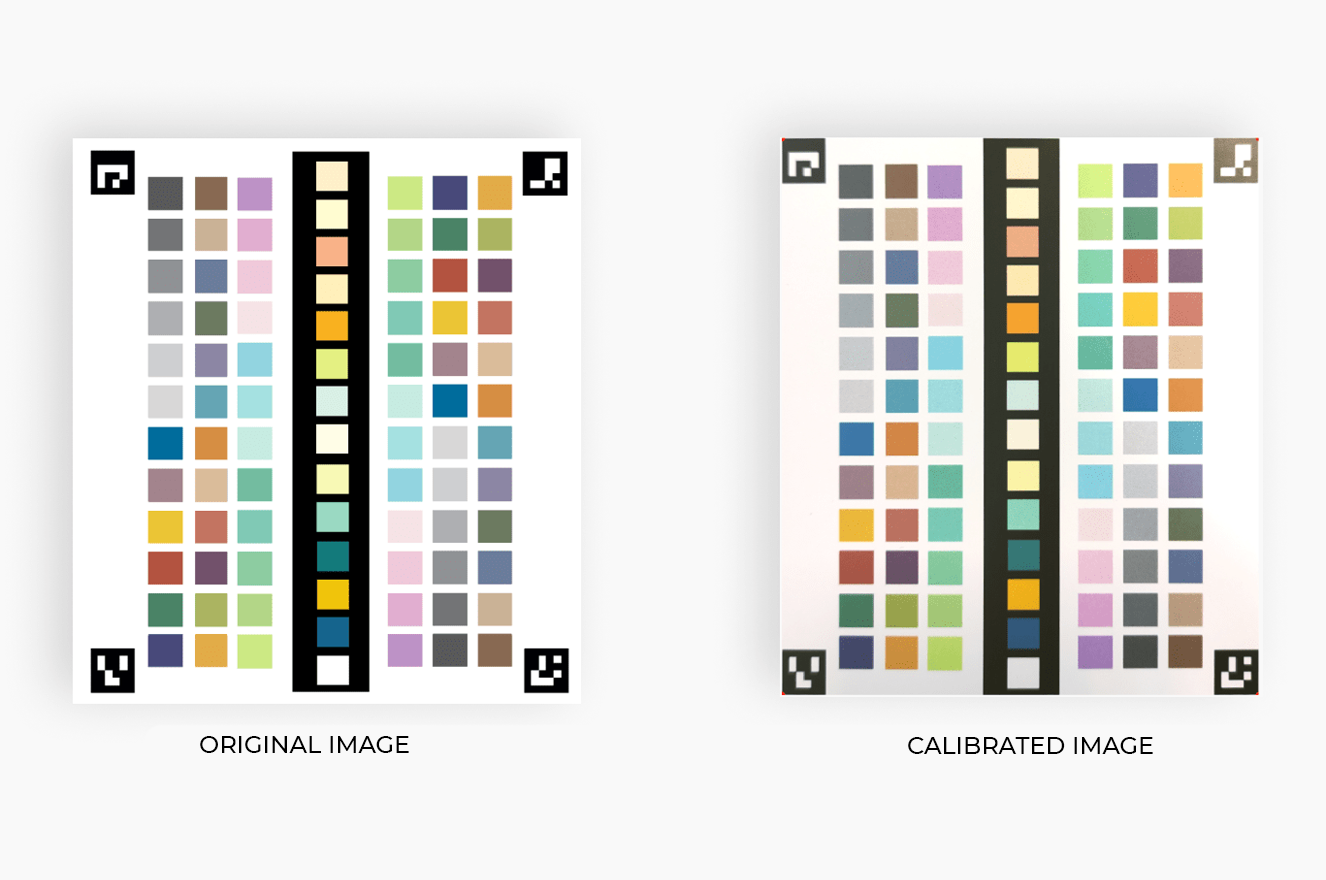
When analyzing image calibration using PLS regression, it turned out that mobile phone cameras often poorly reproduce some shades of colors.
Mobile phones often poorly capture certain shades. Bright colors, like blue, bright green, light green, hot pink, and pale pink often cause trouble during color calibration.
These colors need to be included into the calibration background so that the system can calibrate the image correctly. This alone can increase the recognition quality up to 97%.
Synthetic vs Real Data
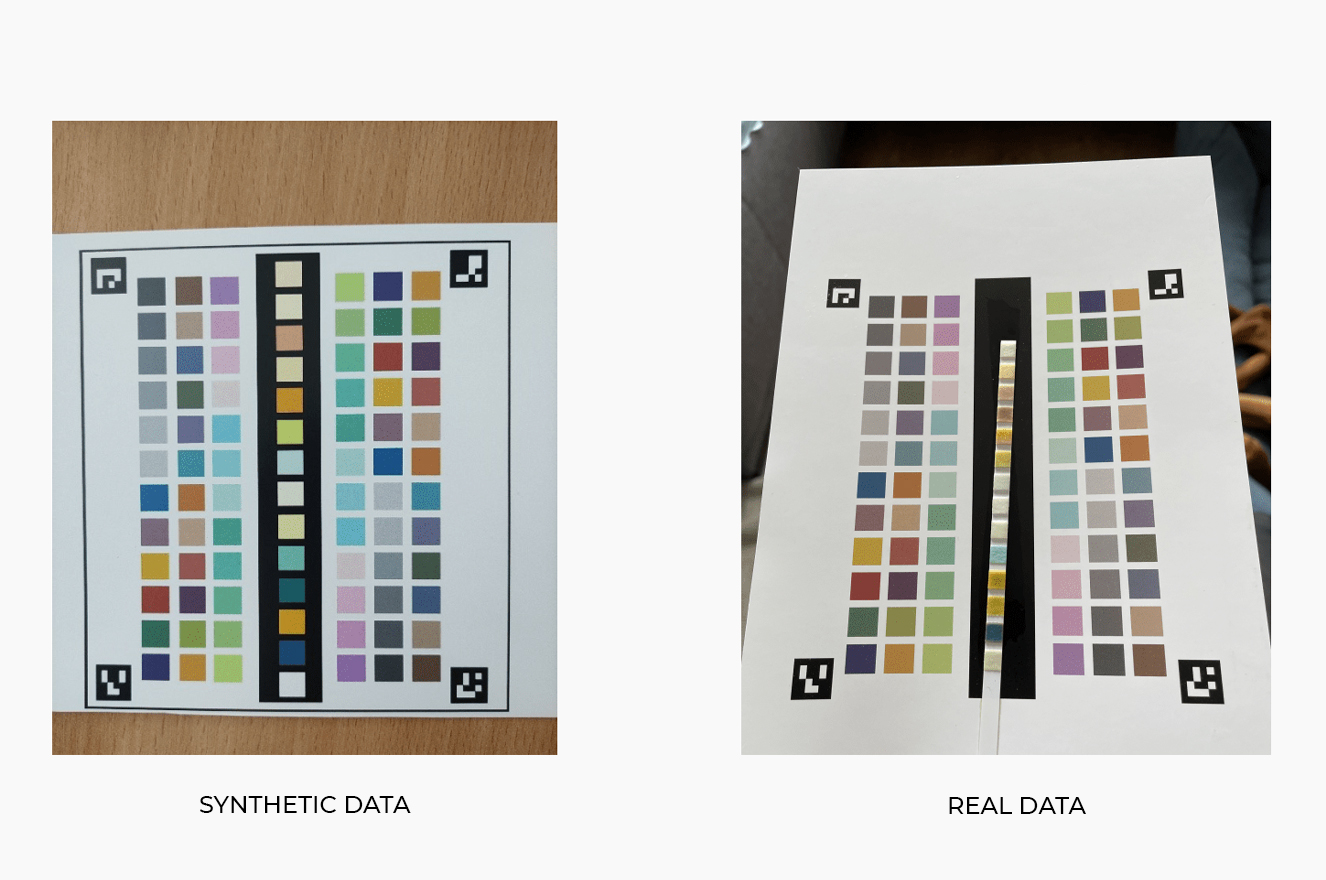
Synthetic data, while being invaluable for initial model testing, can be quite different from real images. In the case of test strips, these are the main difference between synthetic and real data:
Real test strips have dimension, texture, and sometimes lens glare, synthetic images are completely flat, have no texture or lighting artifacts of any kind
Synthetic data is printed on a black background for easier model training, while the chemical pads of real test strips have a white background, which reduces the contrast between the background and light chemical pads
Due to the differences in real and synthetic data, it is necessary to adjust the model to detect chemical pads and their colors more accurately.
One of the most common ways of detecting object contours is by converting the image to grayscale and applying binarization: all shades below the threshold value become black, all shades above this value become white, which helps to detect object contours.
However, in cases with low contrast this method fails to produce adequate results and fails to detect the contours of chemical pads.
There are several different methods one could use in this situation:
- Locating the chemical pad coordinates: this method doesn’t work well since the photo may be taken at an angle, resulting in a warped perspective, thus distorting the size of the chemical pads and the distance between them
- Locating the chemical pads via a saturation histogram: this method also doesn't work very well since some light squares are much lighter than the spaces between them, making it difficult for the algorithm to determine the distance between them.
- Locating the chemical pads using dispersion: different values of the distance between the squares and the sizes of the squares are sorted out. For each pair of values, the variance is found. If the total (over all squares) dispersion is small, then the color difference inside the squares is small, that is, we have found the optimal positions of the squares. The variance showed how much the RGB values of the colors in the resulting square differ from the average RGB value in this square. We chose this method to determine the frames of reagent squares.
Lighting Artifacts
The use of flash alone can increase the accuracy by 10-15%. Photos taken without flash often have shadows or glare from light sources close to the test strip, thus making it difficult for the neural network to detect the colors accurately.
The solution to this problem is very simple. To improve the accuracy of the results and eliminate errors caused by inaccurate color calibration due to shadows, the app can alert the user about the need to use flash.
Results
A model trained on both synthetic and real data can be integrated into a personal wellness mobile app like we did in our urine testing strip app.
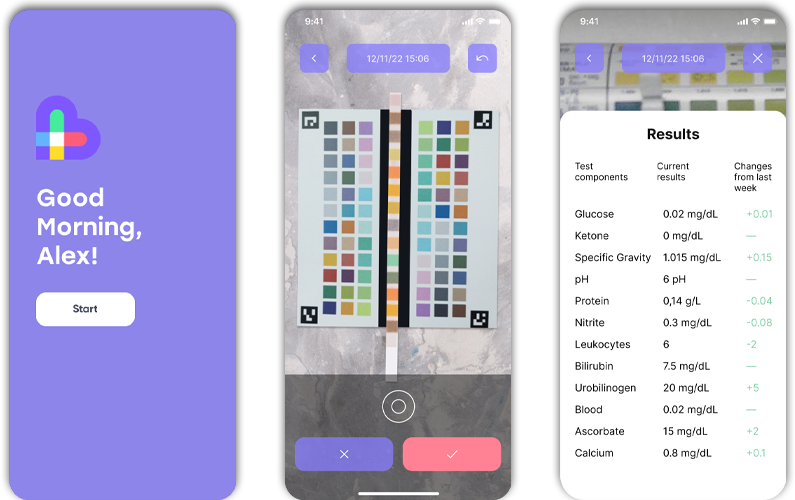
The mobile app can be introduced to consumers as a neat way of tracking their key health markers. Coupled with a user-friendly interface, the product turns into an indispensable tool for health-conscious users.
High Standards Of AI Healthcare
Medical setting implies high standards of data quality. AI healthcare projects are always harder to create than others, as high standards leave no room for mistakes.
Having worked on multiple AI healthcare projects, we at Businessware Technologies have amassed experience in creating highly accurate AI systems that strike a balance between high recognition quality and fast performance.
Testing strips, while being less accurate than other in-house diagnostic methods, still require high recognition accuracy. Rigorous testing of the system, using latest approaches to machine learning development are all necessary steps when working on an AI healthcare project.
We at Businessware Technologies have created numerous AI healthcare systems, and have amassed heaps of experience in the field. This has helped our machine learning team to approach this new project with confidence, and we managed to develop the app, along with the neural network, in less than two months.
The app is now being tested with a limited audience, and hopefully soon will go public as part of a personal wellness system.