Introduction
Large language models have made huge strides in natural language understanding — summarizing documents, writing code, answering questions. But most real-world workflows involve much more than plain text.
Technical formats like spreadsheets, tables, invoices, and engineering drawings are at the core of industries ranging from finance to manufacturing. Can today’s top AI models actually handle them?
We set out to answer a focused, practical question:
Which general-purpose AI model performs best on real-world technical inputs?
Not synthetic prompts. Not cherry-picked examples. But messy, high-stakes inputs like OCR’d tables and scanned engineering diagrams — the kind professionals work with every day.
This wasn’t academic curiosity — it was a hands-on benchmark built to guide real-world decisions. Whether you're building an enterprise copilot, automating document workflows, or extracting structured data from messy PDFs, you need to know: Can GPT-4 handle this? Should you trust Claude 3? Is Gemini any good at spatial reasoning?
Note: In this benchmark, we evaluated models available at the time. We continuously monitor new models entering the market and plan to update this benchmark to include emerging LLMs such as GPT-5 and others.
Experience AI for Engineering Drawings
Datasets & Methodology
To find out which AI models perform best on real-world technical inputs, we benchmarked them across two distinct but equally challenging domains: tabular data from architectural documents and dimensional annotations in engineering drawings.
Tested AI Models
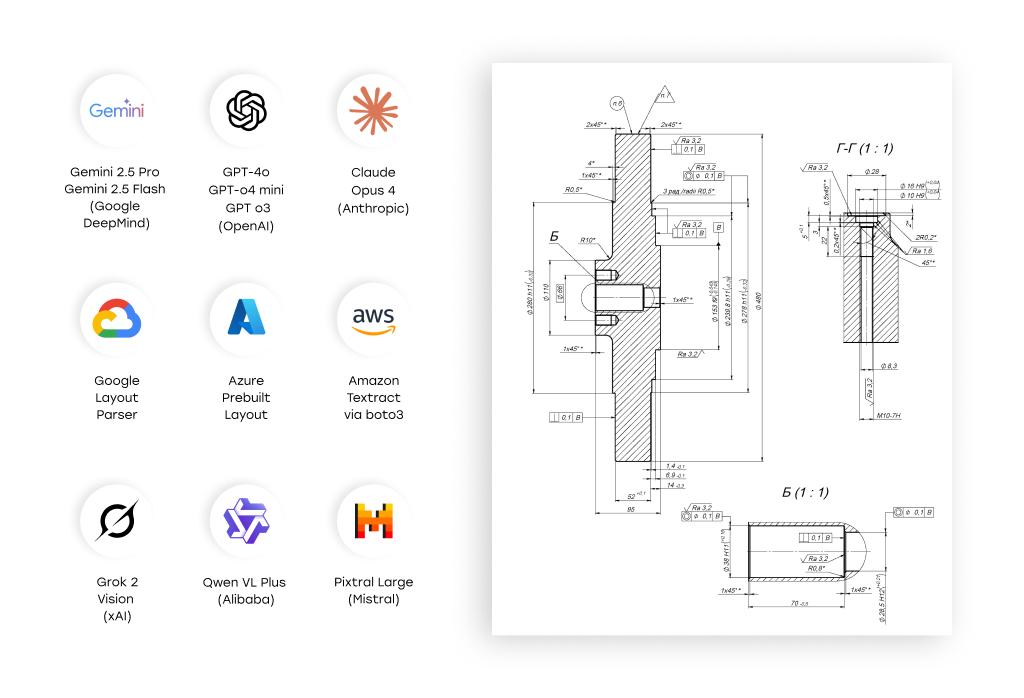
We tested a total of 11 models across both tasks, chosen for their popularity, accessibility, or demonstrated capability with multimodal inputs. These include both vision-enabled LLMs and specialized layout parsers:
- LLMs with Vision Capabilities
- GPT-4o, GPT o4 mini, GPT o3 (OpenAI)
- Claude Opus 4 (Anthropic)
- Gemini 2.5 Pro, Gemini 2.5 Flash (Google DeepMind)
- Grok 2 Vision (xAI)
- Qwen VL Plus (Alibaba)
- Pixtral Large (Mistral)
- Traditional Layout Models
- Amazon Textract via boto3
- Azure Prebuilt Layout
- Google Layout Parser
No fine-tuning or multi-shot learning was applied — we evaluated models in their default general-purpose form to simulate real-world deployment conditions.
Tabular Data Benchmark
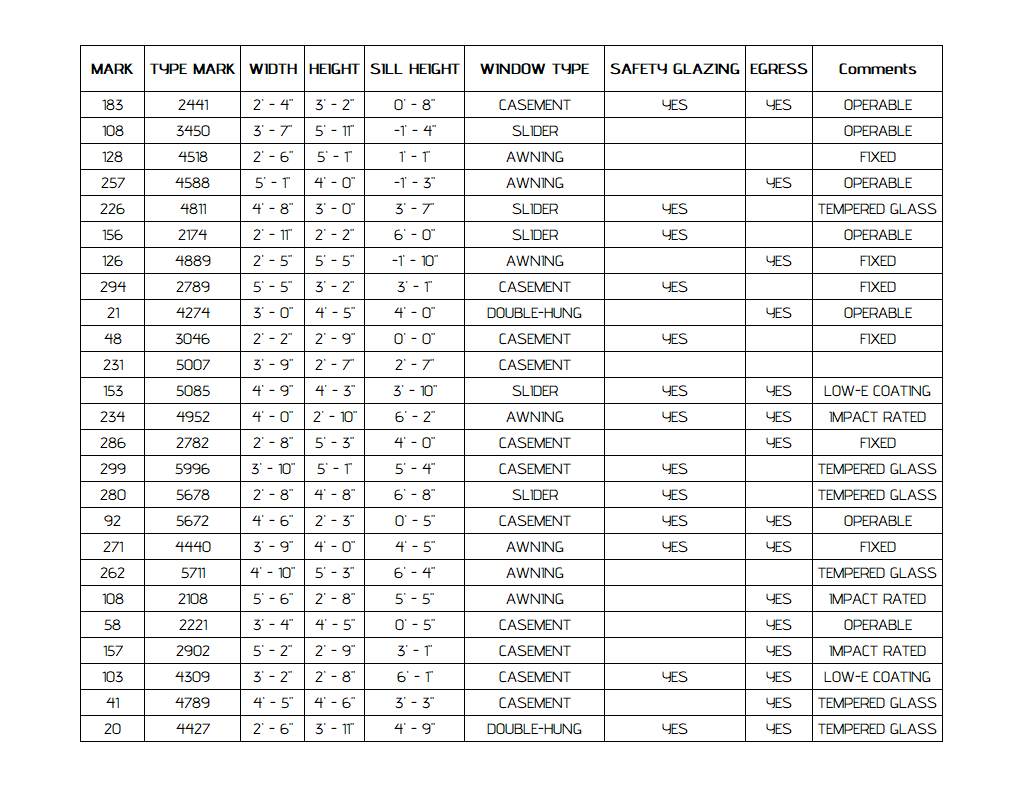
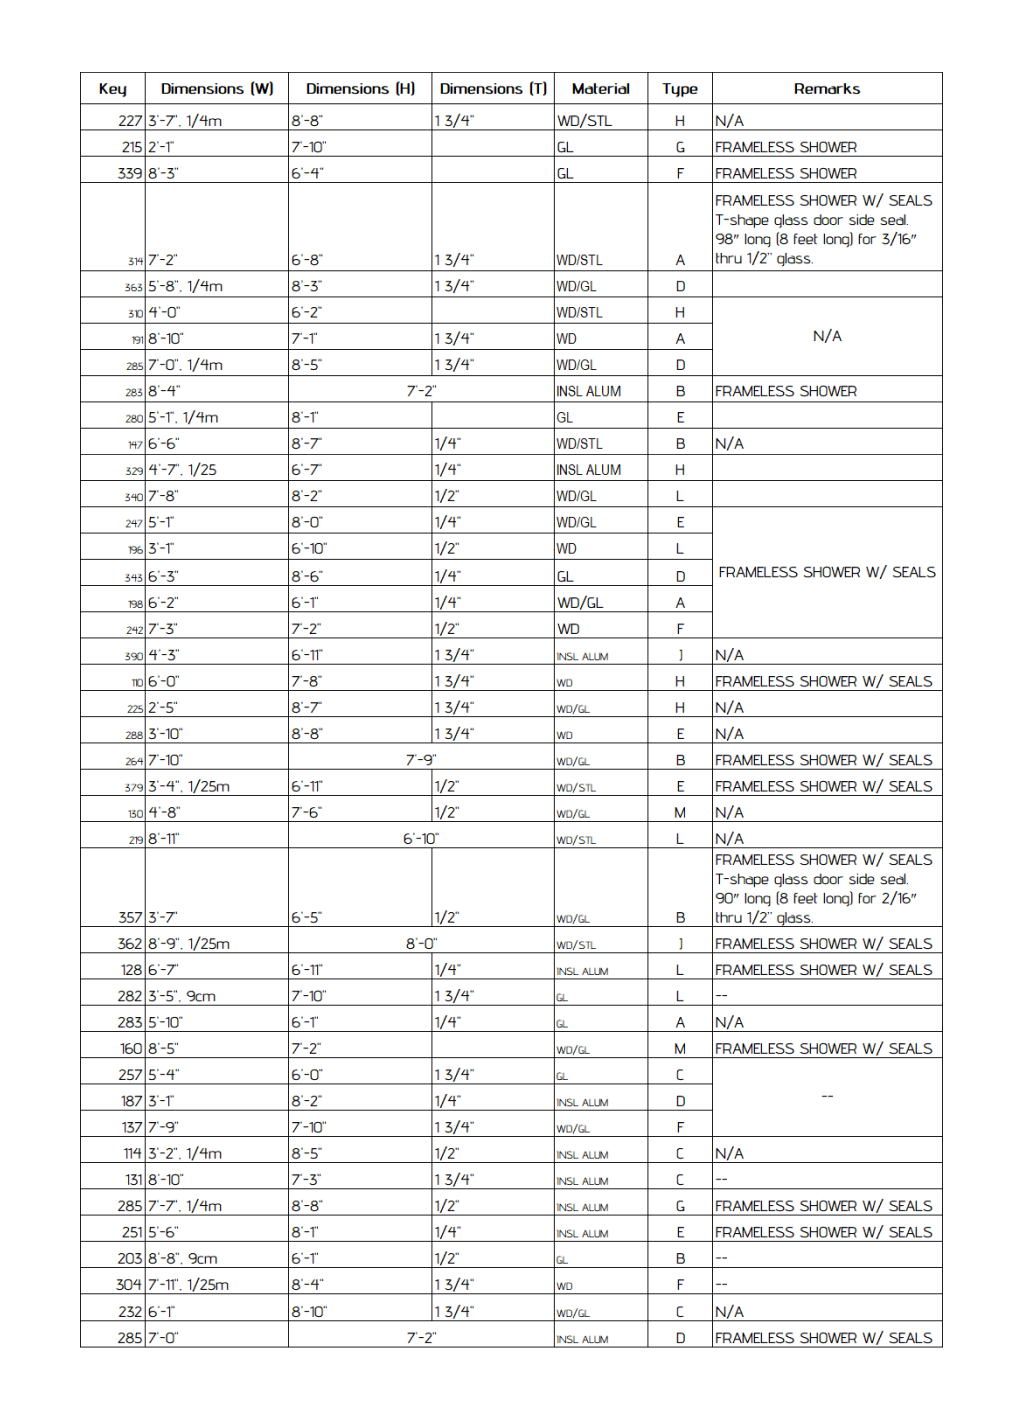
Dataset: 18 architectural drawings containing 20 tables (mostly door/window schedules). Table sizes ranged from 7×3 to 38×18 cells. All inputs were in English and presented in PDF format.
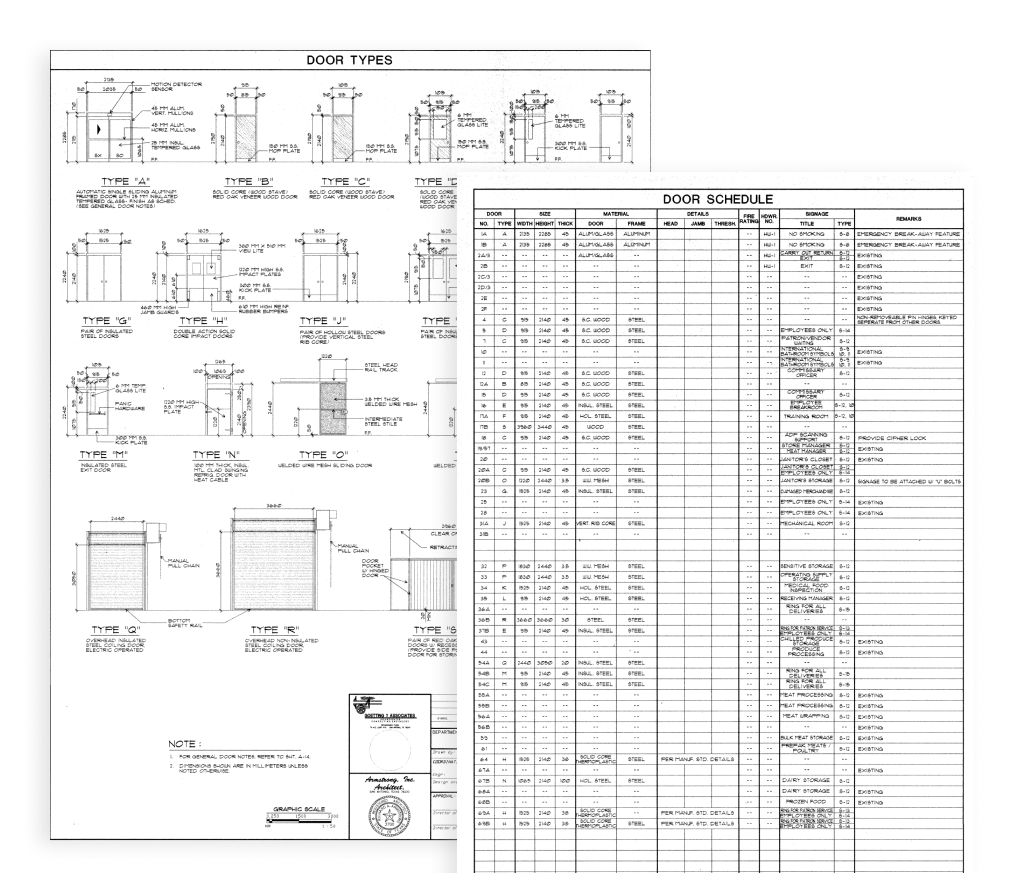
Task: Extract complete structured tables from the drawings, preserving row-column structure and content.
Metric:
- Total Cells = rows × columns
- Efficiency (%) = correctly extracted cells ÷ total cells × 100
Ground Truth: Hand-labeled JSON tables based on the PDFs. All outputs were reviewed for cell-level accuracy.
Engineering Drawing Benchmark
Dataset: 10 real-world mechanical engineering drawings, each containing 17–58 annotated dimensions.
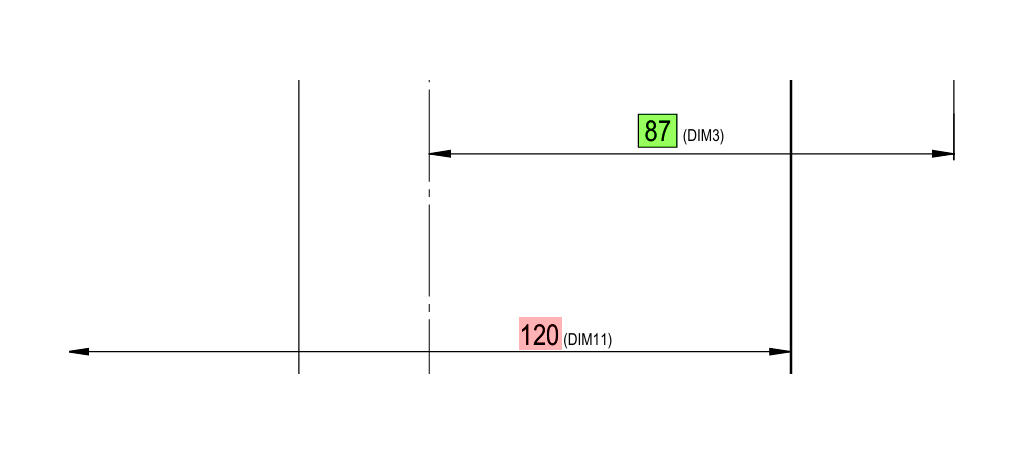
Task: Extract key dimensional attributes from each drawing, including:
- View name, dimension type, nominal value, tolerances (upper/lower), feature count, geometric tolerances, surface finish, and reference flags.
Metric: Full-field match against ground truth. A dimension was only marked “correct” if all fields were accurately extracted.
Review Process: Manual validation of model outputs against annotated drawings.
Prompt For Extracting Data From Engineering Drawings With LLMs
While model choice and dataset quality play major roles in AI benchmarking, we found that prompt design is equally critical — especially for complex tasks like extracting dimensional information from technical blueprints.
In this article, we’re publicly sharing the full prompt that powered our extraction of dimensions and tolerances from complex engineering drawings. Why? Because it’s not just a benchmarking tool — it’s production-ready and can be directly used in real-world automation pipelines.
This prompt was designed with practical deployment in mind. It guides the LLM to act like a meticulous Quality Control Engineer, outputting a highly structured JSON representation of all dimensions, annotations, tolerances, and notes — organized by view, with full metadata.
If you're building document processing tools for manufacturing, QA automation, or digital workflows, this prompt can save you weeks of development and trial-and-error. You can plug it directly into your LLM pipeline (ChatGPT, Gemini, Claude, etc.) and get highly structured output without starting from scratch.
We’ve included the full version of the prompt below so you can test it, modify it, or integrate it into your own projects.
IDP Models Benchmark
We are constantly testing large language models for business automation tasks. Check out the latest results.
Results: Which Models Performed Best?
We evaluated each model on two distinct real-world tasks: structured table extraction from construction drawings, and complex dimension recognition in engineering diagrams. The goal was not just to measure accuracy, but to understand which models are actually usable in practical, cost-sensitive workflows.
1. Table Extraction (from Construction Drawings)
|
Service |
Table Extraction Accuracy |
Processing duration Per 1 Page, s |
Cost, per 1000 pages |
|---|---|---|---|
|
81,5% |
4.3 ± 0.2 |
$10 |
|
|
82,1% |
2.9 ± 0.2 |
$15 |
|
|
94,2% |
47.4 ± 15.7 |
$58 |
|
|
38,5% |
16.9 ± 1.9 |
$19 |
|
|
Failed |
— |
— |
|
|
Failed |
— |
— |
|
|
Failed |
— |
— |

Best overall: Gemini 2.5 Pro, with nearly perfect extraction accuracy — though with significantly higher latency and cost.
Best value: Amazon Textract and Azure Layout offer solid performance for document-heavy pipelines with tight cost constraints.
Biggest surprise: GPT-4o underperformed drastically, struggling to maintain table structure even in moderately complex layouts.
Worst performer: Grok, Pixtral, and Google Layout Parser were excluded after consistent failure to parse even basic tables.
2. Dimension Recognition (from Engineering Drawings)
|
Service |
Data Extraction Efficiency |
Processing duration Per 1 Page, s |
Cost, Per 1000 Pages |
|---|---|---|---|
|
77.34% |
77.5 |
$30.5 |
|
|
79.96% |
91.4 |
$130.4 |
|
|
39.59% |
41.75 |
$24.9 |
|
|
20.38% |
163 |
$239.2 |
|
|
40.49% |
64.8 |
$312 |
|
|
7.64 |
22 |
$1.59 |
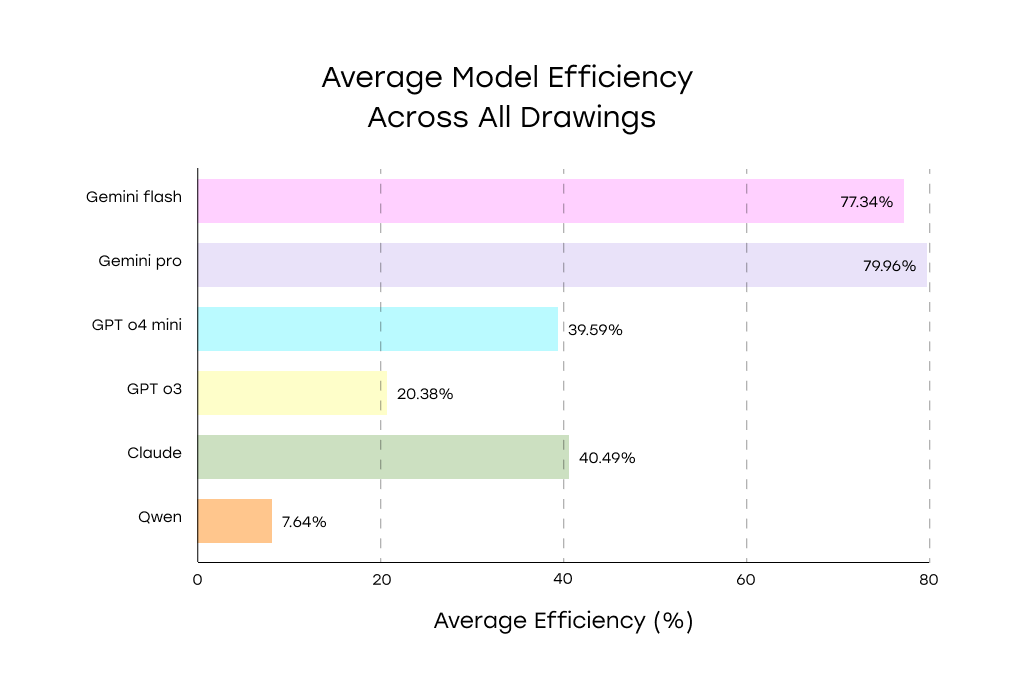
Best overall: Gemini Pro and Gemini Flash led the benchmark, showing robust accuracy even in dense technical drawings with complex tolerancing.
Middle tier: Claude Opus and GPT-4o Mini handled simple layouts decently but broke down with multi-annotation drawings.
Worst performer: Qwen VL Plus frequently missed entire sections and was unreliable even on basic annotations.
Cross-Test Model Results
- Gemini consistently outperformed other models in both table and drawing tasks, though its Pro variant comes with a steep latency and cost trade-off.
- GPT-4o's performance varied wildly: it struggled with both table structure and dimensional data, despite strong NLP capabilities elsewhere.
- Traditional tools like AWS Textract and Azure Layout remain reliable for structured table extraction — they’re fast, cheap, and surprisingly accurate for layout-bound tasks.
- No model was universally good: the best choice depends heavily on input type, layout complexity, and tolerance for cost/latency.
Accelerate Blueprint & Plan Interpretation with AI
Key Insights from Testing
Our benchmarks revealed consistent patterns in where current AI models excel — and where they struggle — when working with structured tables and engineering drawings.
Simpler Inputs Yield High Accuracy — Regardless of Model
All top-performing models, including Gemini Pro, Azure, and AWS Textract, achieved near-perfect results on tables with:
- Uniform fonts
- Single-line text
- Simple headings
- No complex formatting (e.g., mixed units like feet and inches)
Similarly, in engineering drawings, models like Gemini Flash and GPT-4 Mini performed best on clean, sparsely annotated layouts.
Insight: When input structure is clean and visually regular, most models can produce accurate results — even without fine-tuning.
Visual and Semantic Complexity Degrades Performance
Model performance dropped significantly on complex table layouts with:
- Multi-line cells or merged rows
- Unusual fonts or small text
- Mixed unit types and embedded metadata
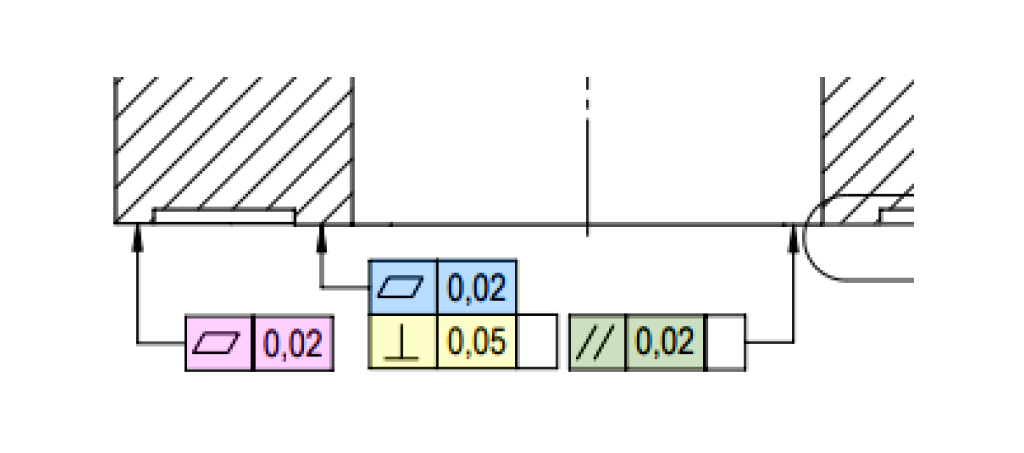
In engineering drawings, mixed one-sided/two-sided tolerances, geometric tolerances, and dense annotation clusters often tripped up even high-performing models. Gemini Flash, for example, sometimes inserted phantom tolerance values that didn’t exist in the source.
Insight: Both visual clutter and semantic ambiguity (like interpreting tolerances) remain hard problems, even for top-tier models.
Common Failure Modes by Model
GPT-4o
- Failed consistently at full-table extraction.
- Truncated output, dropped rows, incomplete cell values.
- No improvement from prompt engineering or higher DPI.
GPT-4o Mini
- Mid-tier in drawings; strong on clean cases, but mismatched tolerance values and merged features hurt reliability.
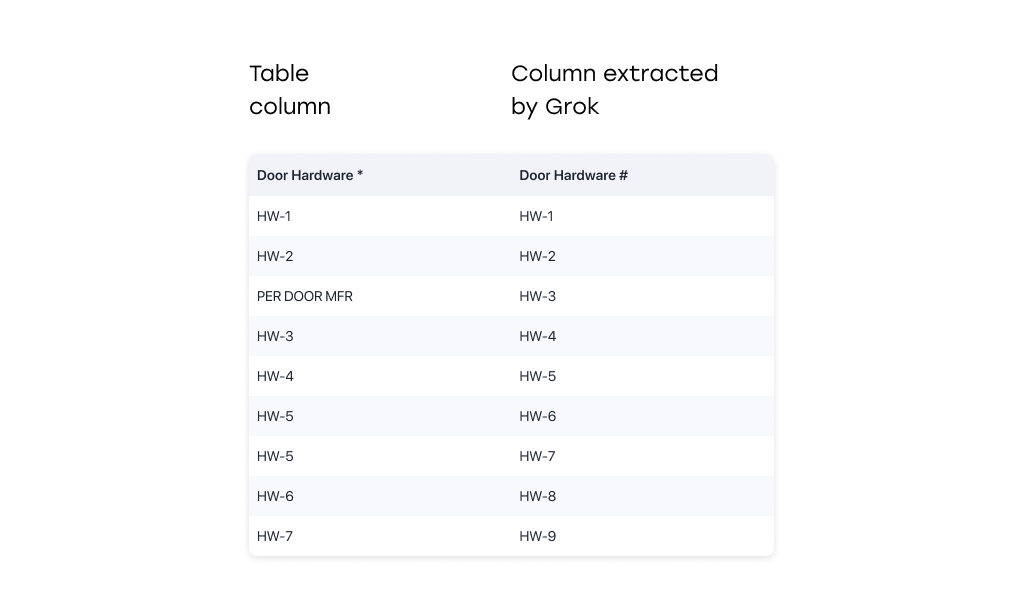
Grok & Pixtral (Mistral)
- Fabricated patterns, invented data.
- Filled in missing values based on heuristics rather than extracting true content.
- Suggested strong generative bias — making them unreliable for extraction tasks.
Qwen VL Plus
- Omitted major drawing sections.
- Misassigned dimensions to wrong views.
- Averaged below 10% accuracy, indicating fundamental limitations in layout understanding.
Claude Opus
- Solid middle performer.
- Sometimes misassigned dimensions across views in engineering drawings.
Insight: Some models don’t just “fail quietly” — they actively fabricate content, making them dangerous for use in structured data extraction workflows without strict validation.
Drawing-Specific Insights
- Gemini Pro and Flash led the field, but each had distinct failure modes (e.g., consolidating identical dimensions, struggling with tolerance formats).
- Models generally performed well in associating each dimension with its correct drawing section or projection and accurately recognizing the section titles, but struggled with geometric tolerances like perpendicularity, flatness or parallelism.
- Layout density was not a dominant factor in model performance — accuracy stayed fairly consistent across sparse and dense layouts.
Insight: Engineering drawings push models not just to "see" but to reason — about tolerances, structure, and view context. This remains an open challenge.
Testing the "Run It Again" Hypothesis
The real-world application of detection models often introduces variability: a single inference may catch some details but miss others. This raises a compelling question—can running a document through a model multiple times and consolidating outputs improve detection reliability?
We investigate exactly that. We evaluated three models—Gemini 2.5 Pro (“gemini pro”), GPT o3 (“gpt o3”), and Claude Sonnet 4 (“sonnet 4”)—across four run-count regimes (1, 2, 5, and 10 runs per document), tracking how consistency, precision, and recall shifted with each extra run. The outcome? A revealing look at which models benefit from this approach—and which don’t.
Objective
The goal of this experiment was to test the hypothesis:
Running documents through the detection models multiple times and consolidating results improves detection performance compared to a single run.
Models evaluated:
- Gemini 2. 5 Pro (referred to as "gemini pro")
- GPT o3 ("gpt o3")
- Claude Sonnet 4 ("sonnet 4")
Summary of methodology
- Each document in the test set was processed repeatedly by each model for three multi-run experiments: 2 runs, 5 runs, and 10 runs, and a single-run baseline (1 run).
- For each model and each run-count, the per-document detections were consolidated into one result.
Consolidation method: identical detections are counted across runs by type. A detection is included in the final consolidated result if it appears in more than 50% of runs. - For each consolidated result (per model × run-count), standard detection metrics were computed against the ground truth: Precision, Recall, and F1. These were computed per-document and averaged.
Definitions of metrics
- Precision = TP / (TP + FP). High precision means fewer false positives among reported detections.
- Recall = TP / (TP + FN). High recall means more true positives are found (fewer missed dimensions).
- F1 score = 2 * (Precision * Recall) / (Precision + Recall). Harmonic mean of precision and recall; balances the two.
Results
The table shows the Precision, Recall and F1 metrics values calculated for 2, 5, and 10 runs of the documents through the Gemini 2.5 Pro, GPT o3 and Claude Sonnet 4 models. The green and red cell colors represent an improvement or a deterioration compared to 1 run.
|
gemini pro |
Precision |
Recall |
F1 |
|||||||||
|---|---|---|---|---|---|---|---|---|---|---|---|---|
|
1 run |
2 runs |
5 runs |
10 runs |
1 run |
2 runs |
5 runs |
10 runs |
1 run |
2 runs |
5 runs |
10 runs |
|
|
1 |
0.85 |
0.83 |
0.82 |
0.78 |
1 |
1 |
1 |
1 |
0.92 |
0.91 |
0.9 |
0.88 |
|
2 |
0.83 |
0.83 |
0.83 |
0.83 |
1 |
1 |
1 |
1 |
0.91 |
0.91 |
0.91 |
0.91 |
|
3 |
0.84 |
0.78 |
0.74 |
0.74 |
1 |
0.98 |
1 |
1 |
0.91 |
0.87 |
0.85 |
0.85 |
|
4 |
0.81 |
0.88 |
0.85 |
0.9 |
1 |
1 |
1 |
1 |
0.9 |
0.93 |
0.92 |
0.95 |
|
5 |
0.87 |
0.8 |
0.83 |
0.83 |
1 |
1 |
1 |
1 |
0.93 |
0.89 |
0.91 |
0.91 |
|
6 |
0.83 |
0.89 |
0.89 |
0.87 |
0.97 |
0.97 |
0.97 |
0.97 |
0.89 |
0.93 |
0.93 |
0.92 |
|
7 |
0.93 |
0.95 |
0.85 |
0.93 |
0.98 |
0.98 |
1 |
0.98 |
0.95 |
0.96 |
0.92 |
0.95 |
|
8 |
0.82 |
0.82 |
0.8 |
0.8 |
1 |
1 |
1 |
1 |
0.9 |
0.9 |
0.89 |
0.89 |
|
9 |
0.81 |
0.89 |
0.9 |
0.89 |
0.94 |
0.94 |
1 |
0.94 |
0.87 |
0.92 |
0.95 |
0.92 |
|
10 |
0.86 |
0.86 |
0.86 |
0.89 |
1 |
1 |
1 |
1 |
0.93 |
0.93 |
0.93 |
0.94 |
|
Average |
0.845 |
0.853 |
0.837 |
0.846 |
0.989 |
0.987 |
0.997 |
0.989 |
0.911 |
0.915 |
0.911 |
0.912 |
|
gpt o3 |
Precision |
Recall |
F1 |
|||||||||
|---|---|---|---|---|---|---|---|---|---|---|---|---|
|
1 run |
2 runs |
5 runs |
10 runs |
1 run |
2 runs |
5 runs |
10 runs |
1 run |
2 runs |
5 runs |
10 runs |
|
|
0.8 |
0.8 |
0.87 |
0.81 |
1 |
0.98 |
1 |
1 |
0.89 |
0.88 |
0.93 |
0.9 |
|
|
0.94 |
0.96 |
0.94 |
0.94 |
1 |
0.87 |
1 |
1 |
0.97 |
0.91 |
0.97 |
0.97 |
|
|
0.7 |
0.76 |
0.82 |
0.87 |
0.94 |
0.96 |
1 |
1 |
0.81 |
0.85 |
0.9 |
0.93 |
|
|
0.89 |
0.85 |
0.92 |
0.8 |
0.97 |
0.97 |
1 |
0.97 |
0.93 |
0.9 |
0.96 |
0.88 |
|
|
0.83 |
0.83 |
0.83 |
0.8 |
1 |
1 |
1 |
1 |
0.91 |
0.91 |
0.91 |
0.89 |
|
|
0.84 |
0.87 |
0.84 |
0.84 |
0.93 |
0.38 |
0.82 |
0.87 |
0.88 |
0.53 |
0.83 |
0.86 |
|
|
0.97 |
0.94 |
0.91 |
0.96 |
0.9 |
0.43 |
0.61 |
0.77 |
0.94 |
0.56 |
0.73 |
0.86 |
|
|
0.68 |
0.75 |
0.73 |
0.82 |
0.88 |
0.56 |
0.71 |
0.9 |
0.77 |
0.64 |
0.72 |
0.86 |
|
|
0.85 |
0.75 |
0.86 |
0.84 |
1 |
0.33 |
1 |
0.89 |
0.92 |
0.46 |
0.92 |
0.86 |
|
|
0.83 |
0.85 |
0.86 |
0.94 |
0.91 |
0.71 |
0.78 |
0.65 |
0.87 |
0.78 |
0.82 |
0.77 |
|
|
Average |
0.833 |
0.836 |
0.858 |
0.862 |
0.953 |
0.719 |
0.892 |
0.905 |
0.889 |
0.742 |
0.869 |
0.878 |
|
sonnet 4 |
Precision |
Recall |
F1 |
|||||||||
|---|---|---|---|---|---|---|---|---|---|---|---|---|
|
1 run |
2 runs |
5 runs |
10 runs |
1 run |
2 runs |
5 runs |
10 runs |
1 run |
2 runs |
5 runs |
10 runs |
|
|
0.89 |
0.94 |
0.94 |
0.94 |
1 |
0.85 |
0.85 |
0.85 |
0.94 |
0.89 |
0.89 |
0.89 |
|
|
0.94 |
0.93 |
0.93 |
0.93 |
1 |
0.83 |
0.83 |
0.83 |
0.97 |
0.88 |
0.88 |
0.88 |
|
|
0.82 |
0.77 |
0.77 |
0.77 |
0.98 |
0.91 |
0.91 |
0.93 |
0.89 |
0.83 |
0.83 |
0.84 |
|
|
0.82 |
0.86 |
0.76 |
0.78 |
0.97 |
0.97 |
0.94 |
0.97 |
0.89 |
0.91 |
0.84 |
0.86 |
|
|
0.95 |
0.91 |
0.91 |
0.91 |
1 |
1 |
1 |
1 |
0.97 |
0.95 |
0.95 |
0.95 |
|
|
0.82 |
0.84 |
0.87 |
0.84 |
0.9 |
0.87 |
0.87 |
0.87 |
0.86 |
0.85 |
0.87 |
0.85 |
|
|
0.77 |
0.79 |
0.79 |
0.81 |
0.96 |
0.81 |
0.79 |
0.81 |
0.86 |
0.8 |
0.79 |
0.81 |
|
|
0.79 |
0.8 |
0.76 |
0.8 |
0.93 |
0.93 |
0.9 |
0.93 |
0.85 |
0.86 |
0.82 |
0.86 |
|
|
0.42 |
0.5 |
0.5 |
0.5 |
1 |
0.83 |
0.83 |
0.83 |
0.59 |
0.63 |
0.63 |
0.63 |
|
|
0.86 |
0.83 |
0.83 |
0.86 |
0.9 |
0.95 |
0.95 |
0.9 |
0.88 |
0.89 |
0.89 |
0.88 |
|
|
Average |
0.808 |
0.817 |
0.806 |
0.814 |
0.964 |
0.895 |
0.887 |
0.892 |
0.87 |
0.849 |
0.839 |
0.845 |
Results interpretation & hypothesized causes
Gemini Pro
Very stable performance across runs, F1 changes are minor. Recall is consistently very high (~0.99), precision around 0.84–0.85. Multiple runs produced no consistent improvement in F1.
This indicates high per-run consistency: true detections are present in nearly every run and spurious detections are rare. The majority (>50%) rule therefore keeps most true positives and filters few false positives — net effect on metrics is minimal.
Conclusion: The very high recall suggests the model already captures most ground-truth items reliably; ensemble consolidation offers little additional benefit (diminishing returns).
GPT o3
Performance is unstable between 1 and 2 runs: F1 drops sharply at 2 runs (0.889 → 0.742) then partially recovers at 5 and 10 runs (0.869, 0.878). Precision slightly improves with more runs, while recall drops dramatically for 2 runs then increases again for 5 and 10 runs.
A strong recall collapse at 2 runs (0.953 → 0.719) is consistent with the >50% majority rule acting as an intersection for N=2 (detections must appear in both runs). GPT o3 likely produces many correct detections intermittently; requiring agreement across both runs removes those intermittent true positives and sharply increases false negatives.
Precision steadily increases with more runs because majority voting filters out occasional false positives — at higher number of runs (5 and 10) some true positives also meet the majority criterion and recall partially recovers, producing improved F1 compared to the 2-run case.
Conclusion: Overall behavior points to high per-run variability: many detections (both TP and FP) appear inconsistently across runs, so behavior depends strongly on the number of runs and the majority threshold.
Claude Sonnet 4
Slightly decreasing F1 with more runs. Precision is roughly flat; recall decreases when using 2 or 5 runs and slightly recovers at 10 runs.
Precision changes are small, indicating false positives are not hugely frequent or are similarly variable.
Sonnet 4 therefore exhibits moderate detection instability: enough to reduce recall when majority thresholds for consolidation are enforced.
Conclusion: Overall, there is no universal improvement in the F1 metric from increasing run counts across all models. Effects are model-dependent.
Cross-model summary
- Stability vs variability: Models that are stable per-run (Gemini Pro) are little affected by majority consolidation; models with variable per-run outputs (GPT o3, Sonnet 4) are more sensitive and can suffer recall losses under strict majority voting.
- Threshold effects: For small numbers of runs, especially N=2, majority voting behaves like an intersection and can catastrophically reduce recall if detections are intermittent. For larger N, majority voting is more tolerant but still filters borderline detections.
- Diminishing returns and noise accumulation: Beyond a few runs, additional runs mostly reinforce stable detections; additional spurious detections that appear rarely do not survive majority voting, so F1 changes flatten.
Other findings from the numbers
- Best single-model stability: Gemini Pro achieved the highest recall and most stable F1 across runs in this dataset.
- Best observed precision trend with multi-run: GPT o3’s precision improved with more runs (0.833 → 0.862). If the consolidation is majority-based, this is expected — majority voting filters out sporadic false positives.
- Worst-case observed drop: GPT o3 showed a marked drop in recall at 2 runs (0.953 → 0.719) causing F1 to drop; this suggests a sensitivity to the consolidation threshold when run count is small.
Practical takeaway
Use single-run or a lower consolidation threshold when recall is prioritized or when a model shows high per-run variability. Use majority voting or a stricter threshold when precision is paramount and the model is reasonably stable.
Cross-Domain Trends in Model Performance
1. Success in One Domain ≠ Success in the Other
Models that excelled at structured table extraction didn’t always perform well on engineering drawings — and vice versa.
- Gemini 2.5 Pro was the only model that performed strongly in both domains, showing high extraction accuracy for complex tables (~94%) and dimensional data (~80%).
- Azure Layout and Amazon Textract handled tables well (over 80% accuracy) but can’t process drawings — they lack visual reasoning and multimodal grounding.
- Claude and GPT-4o Mini were mid-tier in drawing interpretation but underwhelmed in table structure preservation and completeness.
Conclusion: Cross-domain generalization is rare. Being good at layout parsing doesn’t guarantee visual-spatial understanding — the underlying model capabilities differ significantly.
2. Bigger Models Weren’t Always Better
Surprisingly, model size or branding alone didn’t predict performance. For example:
- GPT-4o underperformed dramatically on both tasks, despite being OpenAI’s flagship multimodal model.
- GPT-4o Mini actually outperformed full GPT-4o on drawings.
- Gemini Flash occasionally beat Gemini Pro on certain samples, suggesting lighter variants may be better tuned for specific formats or latency constraints.
- Claude Opus delivered only average results and struggled with spatial localization in drawings.
Conclusion: Scale helps — but only if paired with task-appropriate training or fine-grained visual-textual alignment. Bigger doesn’t always mean smarter.
3. Multimodal Training > Traditional Layout Tools
Traditional tools like AWS Textract and Azure Layout remain useful for strictly structured tables, but fail completely in visual-spatial tasks like engineering drawings. Conversely, multimodal LLMs (Gemini, GPT, Claude) were the only models capable of parsing layouts, dimensions, and tolerances.
However, many vision-enabled models — like Grok and Pixtral — hallucinated or fabricated data, likely due to generative training biases.
Conclusion: Multimodal training is necessary but not sufficient. Only models trained with precise alignment between visual and structured data can succeed across domains.
Beyond the Benchmark: Real-World Patterns and Optimization Strategies
Table Size ≠ Performance Bottleneck
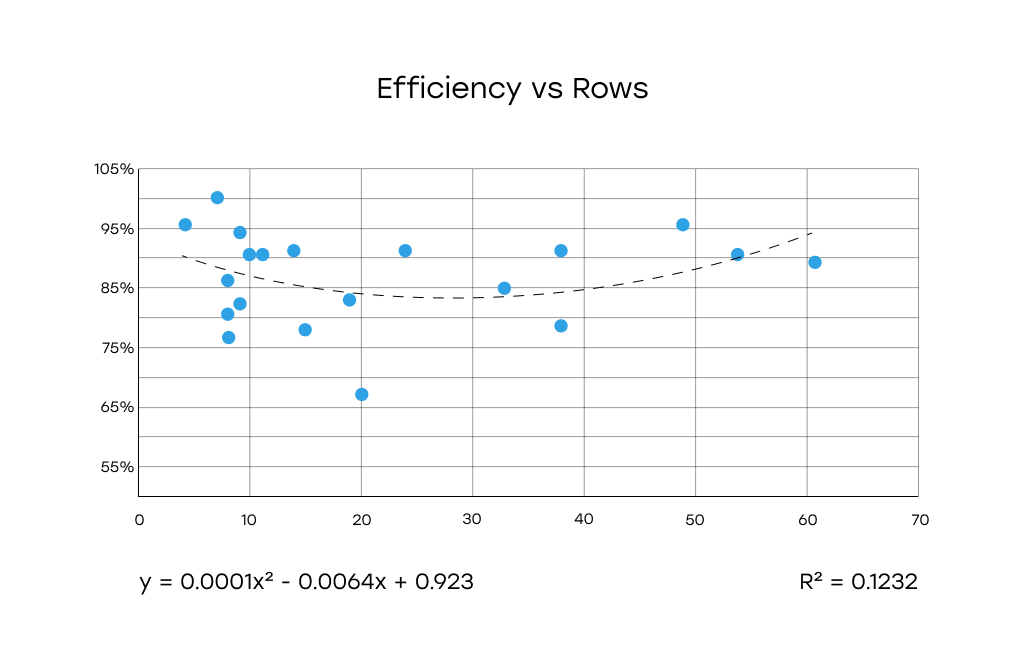
A common belief in document AI is that larger tables — with more rows, columns, or total cells — degrade extraction accuracy. To test this, we plotted model efficiency (Azure, AWS, Gemini) against:
- Number of rows
- Number of columns
- Total cell count
Analysis
Efficiency vs Rows: the graph indicates a weak correlation. There may be a minor non-linear pattern, but the relationship is not strong or conclusive.
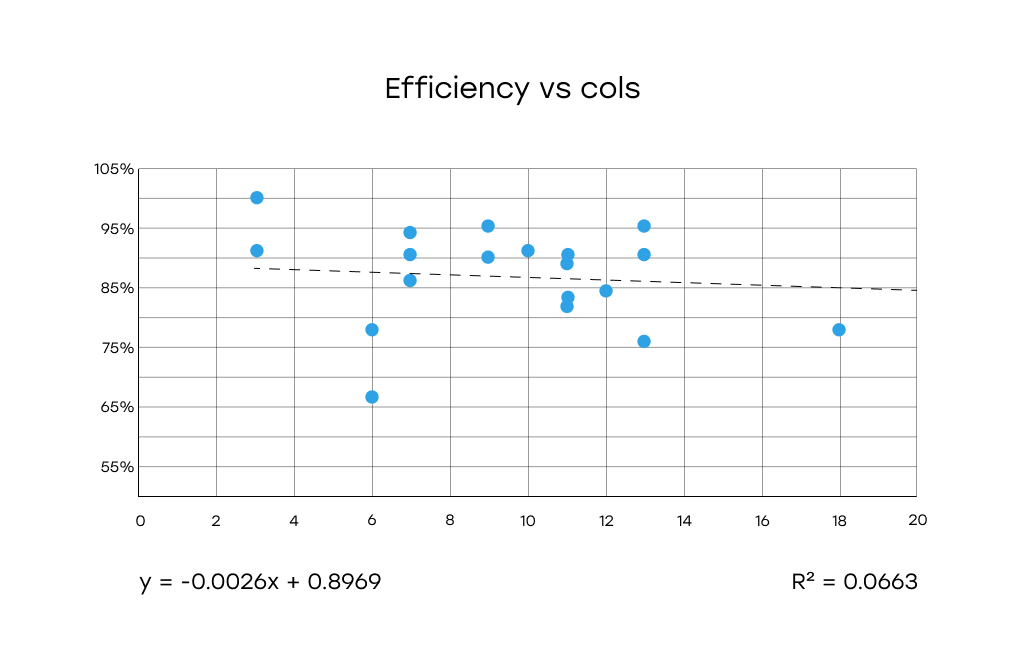
Efficiency vs Columns: The data points are highly scattered. The number of columns does not appear to significantly impact detection efficiency.
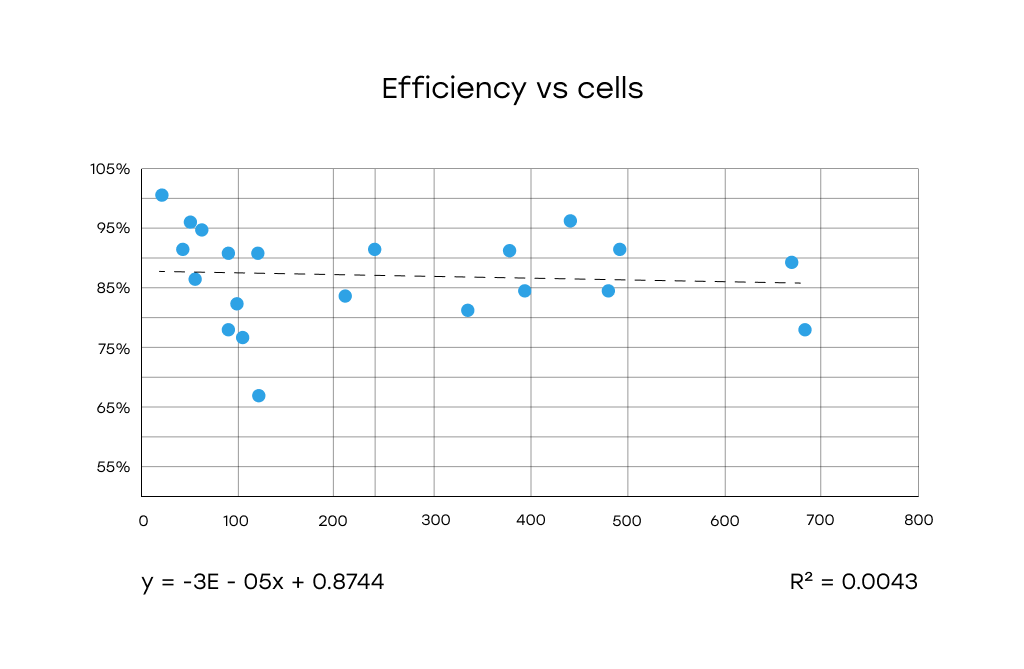
Efficiency vs Total Cells: No meaningful correlation between total number of cells and detection efficiency.
Comparative Analysis (Azure, AWS, Gemini):
- Gemini consistently outperformed both Azure and AWS, showing high and stable efficiency even at larger cell counts.
- Azure and AWS showed more variability and drops in performance, especially in the 100–300 cell range.
- However, even across all services, no clear downward trend was observed with increasing cell count.
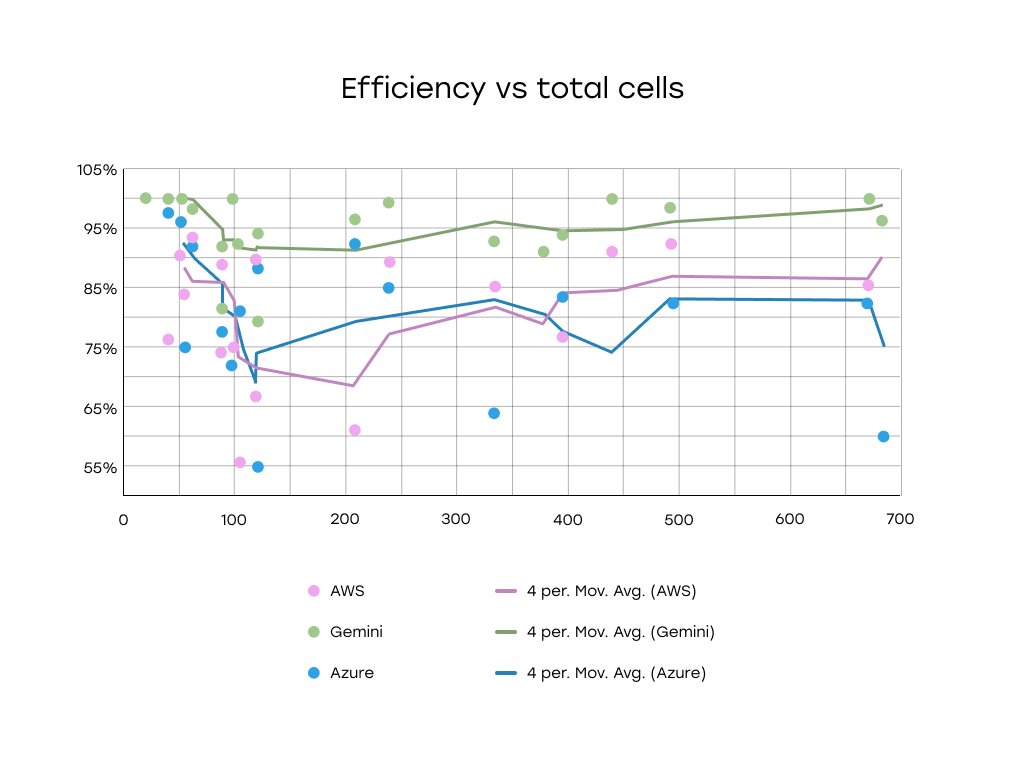
Conclusion: Table Size Alone Doesn’t Predict Extraction Efficiency
The analysis revealed no strong or consistent correlation between table size (in terms of rows, columns, or total cells) and detection efficiency.
While certain services, notably Gemini, maintain high performance across a wide range of table sizes, the overall variability in performance appears to be influenced by other factors not captured in cell count alone.
Key takeaway: Visual complexity, formatting consistency, and semantic clarity matter more than size.
Strategies to Improve AI Extraction in Practice
While no model was perfect — especially on dense engineering drawings — there are ways to boost performance even without switching models:
Model Ensemble
Different models have different strengths:
- Some are better at geometric tolerances
- Others excel at clean linear dimensions or mixed annotations
Combining multiple models and merging their outputs can significantly improve recall, reduce omissions, and increase confidence in edge cases.
Iterative Inference
Running the same model multiple times with prompt variations or randomized seeds uncovered extra dimensions missed on the first pass.
Why it works:
- Models can "notice" different elements in each pass
- You reduce the chance of systematic blind spots
This is especially helpful if you're constrained to a single model API but want higher coverage.
Model Recommendations & Final Conclusions
After benchmarking 11 popular AI models across two distinct technical tasks — table extraction from architectural documents and dimensional data extraction from engineering drawings — clear performance patterns emerged. Some models stood out across both tasks, while others were highly specialized (or simply unreliable).
Here’s a breakdown of what worked, what didn’t, and where each model fits best.
Top All-Around Models (Strong in Both Domains)
Gemini 2.5 Pro
- Best overall performer across both tasks: 94.2% accuracy on tables, 79.96% on drawings.
- Handled complex layouts, mixed units, and tolerances with high consistency.
- Downsides: Higher latency (~90s/page on drawings) and cost.
- Best for: High-accuracy enterprise applications involving technical drawings or structured documents.
Gemini 2.5 Flash
- Close second in drawings (77.34%) and occasionally outperformed Pro on specific layouts.
- Faster and cheaper than Pro, though slightly less robust on complex tolerances.
- Best for: Faster visual processing where slightly lower accuracy is acceptable.
Best Models for Table Extraction
Amazon Textract and Azure Layout
- Solid performers on table tasks (82.1% and 81.5% accuracy, respectively).
- Extremely fast (2.9–4.3 seconds/page) and cost-effective.
- Cannot handle drawings or spatial reasoning.
- Best for: Batch processing of scanned forms, invoices, schedules, or PDFs with clean table layouts.
Mid-Tier Drawing Models (Usable with Caution)
Claude Opus 4
- Moderate performance (~40%) on engineering drawings.
- Occasionally misassigned dimensions across views, but worked well in simpler layouts.
- Best for: Early-stage prototyping or semi-structured drawing interpretation, with human review.
GPT-4o Mini
- Competitive in clean drawings (~39.6%) but struggled with tolerance consistency.
- Outperformed full GPT-4o in some cases.
- Best for: Simple layouts with limited annotation density.
Low Performers & Inconsistent Models
GPT-4o
- Underperformed on both tasks — low table accuracy (38.5%) and weak drawing handling.
- Frequent truncation, incomplete outputs, and structural failures.
- Not recommended for structured or spatial data extraction in current state.
GPT-o3
- Baseline-level performance (20.38% on drawings).
- Lacked reliability, frequently misassigned dimensions and tolerances.
- Not production-ready without extensive post-processing.
Qwen VL Plus
- Lowest performer on drawings (~8%).
- Missed entire sections, misassigned views, unreliable output.
- Not viable for any technical data extraction task.
Grok 2 Vision & Pixtral Large (Mistral)
- Both hallucinated data in table tasks: invented rows, fabricated patterns.
- Failed to extract accurate structured outputs.
- Excluded from analysis due to unreliability.
Google Layout Parser
- Could not detect relevant tables in architectural documents.
- Returned unrelated blocks of text.
- Not functional for the tested task.
Final Takeaways
- Only one model — Gemini Pro — consistently excelled at both structured (tables) and semi-structured (drawings) inputs.
- Model scale alone doesn't guarantee accuracy — smaller models like GPT-4o Mini outperformed larger ones in some drawing tasks.
- Traditional tools (Azure, AWS) are still competitive for well-structured, layout-constrained table tasks.
- Multimodal capabilities are essential for working with visual data — but not all vision-enabled LLMs are reliable.